A good way of doing this is with a graph of nodes, kinda like the following:

You can see how each node can represent a word, and the links between nodes (words) can be coloured or widened to indicate how often one word is followed by the next.
It would also be great to be able to play with the elements, to shift them around or zoom into a big graph.
D3.js
There is a really popular javascript library for creating rich and interactive visualisations called d3. Check out their gallery to get a feel for the really cool, and interactive, visualisations it can make. There's even more here ... I can't get enough of them!Here's an example of an live interactive graph at bl.ocks.org .. have a go at dragging the nodes around.
You can see it constantly reshapes to maximise the visibility of each node, whilst trying to maintain the links between them.
Problem: D3.v4.js in a NoteBook (from a Library)
Plotting images and charts in a notebook is easy and has been done for a long time. You may already know about matplotlib, the de-facto library for plotting in a notebook.Working with d3.js is slightly different because it is a javascript library - that means it needs to work in the browser. Normally tools would work behind the scenes in the engine (notebook kernel) and once the results were created, they would be pushed to the browser to be displayed. Javascript libraries don't do that - the do the work in the browser.
So d3.js plots are created in the browser. How do we do that with a jupyter notebook?
Luckily, there is a fairly mature method for executing HTML and Javascript in a notebook cell. Here's a super simple example:

You can see how an object is created from the raw HTML, and then this object is "displayed" .. or rather executed. That's cool!
You can find more examples of executing rich media in a notebook cell here ... including examples showing how javascript can be executed in a browser notebook.
If we're developing a toolkit visualisation library, we don't want the user to type all that stuff into a cell and then execute it. That would defeat the point of a library that takes all the details away.
Can we run the above python in a library function, for the results to be displayed in a notebook? Yes, we can!
Here's a basic library function which does the HTML mangling so the notebook user never sees it:
import IPython.display
def test_html(s):
# create html object
h = IPython.display.HTML(s)
IPython.display.display_html(h)
pass
And here is what it looks like ... nice and simple!
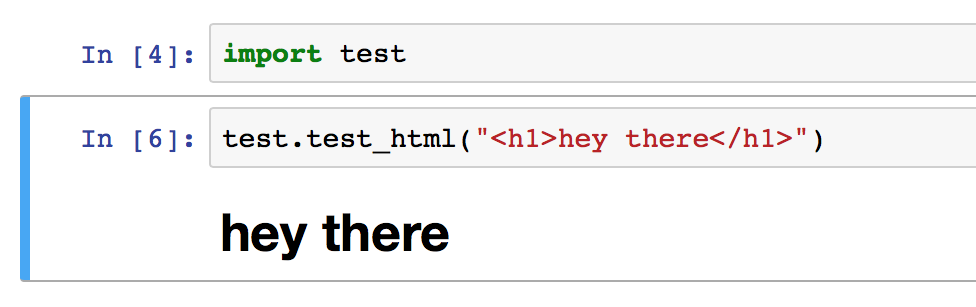
That's how we want to use d3 ... by getting a library to do all the HTML and Jascripty stuff. Let's try it:
import IPython.display
def test_html(s):
# create html object
h = IPython.display.HTML(s)
IPython.display.display_html(h)
pass
def test_d3():
html_string = """
<svg width="400" height="200"></svg>
<script src="https://d3js.org/d3.v3.min.js"></script>
"""
js_string="""
console.log(d3);
var svg = d3.select("svg");
var circle = svg.append("circle")
.attr("cx", 100)
.attr("cy", 100)
.attr("r", 40)
.attr("fill", "blue")
.attr("stroke", "black");
"""
h = IPython.display.HTML(html_string)
IPython.display.display_html(h)
j = IPython.display.Javascript(js_string)
IPython.display.display_javascript(j)
pass
You can see how we use d3 to select the SVG HTML element and then create a circle inside it.
Here's what happens:

Ok .. that didn't work! Seems like d3 isn't visible from the python library when used in a notebook. hmmm... even more weird is if you just hit it again, it works:

That's not inspiring confidence .. and anyway we want to work with d3.v4 not d3.v3 ... let's see what happens if we change the source URL to point to https://d3js.org/d3.v4.min.js:

A similar error, and this one doesn't go away like the other one did by repeatedly calling the function.
So we have a problem to fix. It might be tempting to work with the d3v3 weird behaviour - but we won't, we'll press ahead and look to the future with the new d3v4 ... we don't want to be locked into an ancient version of a library. And anyway, we want to fix the problem properly if we can, not reply on some wobbly workaround.
Diagnosis
I'm not an expert but after a week of wrestling with this ... and terrible documentation ....The problems seem to be due to a different way that the d3.v4.js library presents itself to whatever it is loaded into.
The v3 version seemed to create a global reference, so anyone could see and call it. That doesn't appear to be the case for v4 .. Again, I'm no expert, but I think it is trying to be clever and present itself based on what it thinks the host environment is ... and it gets it wrong when the host is a Jupyter notebook.
The various tickets on this seem unanswered - e.g. http://stackoverflow.com/questions/39335992/d3-4-0-does-not-create-a-global-d3-variable-when-imported-into-jupyter-notebook
To make things worse, browsers and/or the notebook seem to cache previous javascript libraries .. making you think things are working when they're not .. or are broken when they're not! To properly test this I needed to close down a browser properly and kill all history/cookies/cache.
My Solution
Here's how I finally got it to work.The key is to use the require.js method to load the d3 library and remove the <script> method of loading the library. The Jupiter notebook already makes use of require.js so we don't need to load that. Note the lack of a ".js" at the end of the URL.
require.config({
paths: {
d3: "https://d3js.org/d3.v4.min"
}
});
require(["d3"], function(d3) {
// do stuff here
}
So let's try it ...

That works! .. and with version 4 of the D3 library too!
Here's a preview of work in progress developing an interactive force-directed graph for word co-occurance .. you can see the node "pear" highlighted. You can't see here, but we can drag the nodes about and let the graph rebalance.

Reference Code
Here's sample reference code for getting d3v4.js working from a Python library invoked by a Jupiter notebook:import IPython.display
def test_html(s):
# create html object
h = IPython.display.HTML(s)
IPython.display.display_html(h)
pass
def test_d3():
html_string = """
<svg width="400" height="200"></svg>
"""
js_string="""
require.config({
paths: {
d3: "https://d3js.org/d3.v4.min"
}
});
require(["d3"], function(d3) {
console.log(d3);
var svg = d3.select("svg");
var circle = svg.append("circle")
.attr("cx", 100)
.attr("cy", 100)
.attr("r", 40)
.attr("fill", "green")
.attr("stroke", "black");
});
"""
h = IPython.display.HTML(html_string)
IPython.display.display_html(h)
j = IPython.display.Javascript(js_string)
IPython.display.display_javascript(j)
pass
No comments:
Post a Comment